
In this tutorial, we'll learn how to install and configure ELK stack on Rocky Linux 10. Centralized logging system using Elasticsearch, Logstash, Kibana.
Introduction
At HostMyCode, we understand the importance of having a robust, centralized logging solution to keep track of server events, application logs, and system metrics. In this tutorial, we guide readers through installing and configuring a centralized logging system using the ELK Stack, ensuring an efficient, scalable, and secure log-management platform.
Why Choose ELK on Rocky Linux 10?
Scalability & Performance: Elasticsearch delivers powerful search and analytics capabilities, while Logstash reliably ingests and processes logs.
Flexibility: Kibana’s customizable dashboards help our team monitor trends, spot anomalies, and generate actionable insights.
Stability: Rocky Linux 10, as a RHEL-compatible distribution, provides long-term support and enterprise-grade stability—ideal for production environments.
Prerequisites
- One Rocky Linux 10 dedicated server or KVM VPS .
- A non-root user with sudo permissions.
How to Install and Configure ELK Stack on Rocky Linux 10
1. Install Java OpenJDK
Elasticsearch and Logstash require Java. We recommend OpenJDK 21:
sudo dnf install -y java-21-openjdk-devel
If your server has installed previous version of Java, you can update it using following command:
java -version
Confirm the output shows Java 21 to ensure compatibility.
openjdk version "21.0.9" 2025-10-21 LTS
OpenJDK Runtime Environment (Red_Hat-21.0.9.0.10-1) (build 21.0.9+10-LTS)
OpenJDK 64-Bit Server VM (Red_Hat-21.0.9.0.10-1) (build 21.0.9+10-LTS, mixed mode, sharing)
2. Add the Elasticsearch Repository & Install
Import Elasticsearch’s GPG key:
sudo rpm --import https://artifacts.elastic.co/GPG-KEY-elasticsearch
Create the repo file at /etc/yum.repos.d/elasticsearch.repo:
nano /etc/yum.repos.d/elasticsearch.repo
Add following content:
[elasticsearch]
name=Elasticsearch repository for 9.x packages
baseurl=https://artifacts.elastic.co/packages/9.x/yum
gpgcheck=1
gpgkey=https://artifacts.elastic.co/GPG-KEY-elasticsearch
enabled=0
autorefresh=1
type=rpm-md
Install Elasticsearch and enable it to start on boot:
sudo dnf install --enablerepo=elasticsearch elasticsearch
Notice after the installation you will see "Security autoconfiguration information". In that information you will find something like:
The generated password for the elastic built-in superuser is : FxADG30DLBlLs+*w8NgS
sudo systemctl enable --now elasticsearch
3. Install Logstash
Reuse the Elasticsearch repo. Then install Logstash:
sudo dnf install --enablerepo=elasticsearch logstash
sudo systemctl enable --now logstash
Create a basic pipeline at /etc/logstash/conf.d/02-beats-input.conf:
sudo nano /etc/logstash/conf.d/02-beats-input.conf
Add following code:
input {
  beats {
    port => 5044
  }
}

filter {
  # Add any grok, date, or mutate filters here
}

output {
  elasticsearch {
    hosts => ["http://localhost:9200"]
    index => "logs-%{+YYYY.MM.dd}"
  }
}
Test pipeline syntax and restart:
sudo systemctl restart logstash
4. Install Kibana
Install the Kibana package:
sudo dnf install --enablerepo=elasticsearch kibana
Configure Kibana to listen on all interfaces by editing /etc/kibana/kibana.yml:
sudo nano /etc/kibana/kibana.yml
Find and make following variables:
server.host: "0.0.0.0"
elasticsearch.hosts: ["http://localhost:9200"]
Enable and start Kibana:
sudo systemctl enable --now kibana
5: Testing the Setup
Navigate to browser and access http://<elk-server-ip>:5601.
You will get a box where you need to add Elasticsearch enrollment token. To generate the token execute following command:
/usr/share/elasticsearch/bin/elasticsearch-create-enrollment-token -s kibana
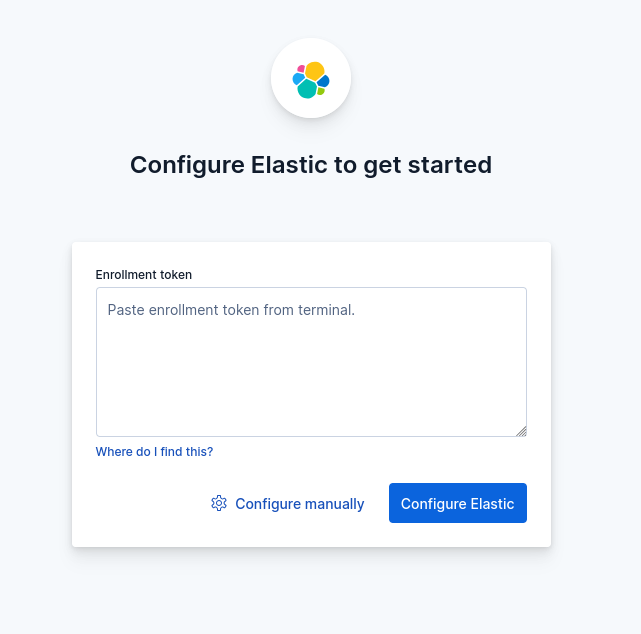
It will give you a token. Copy that token and paste it in the browser.
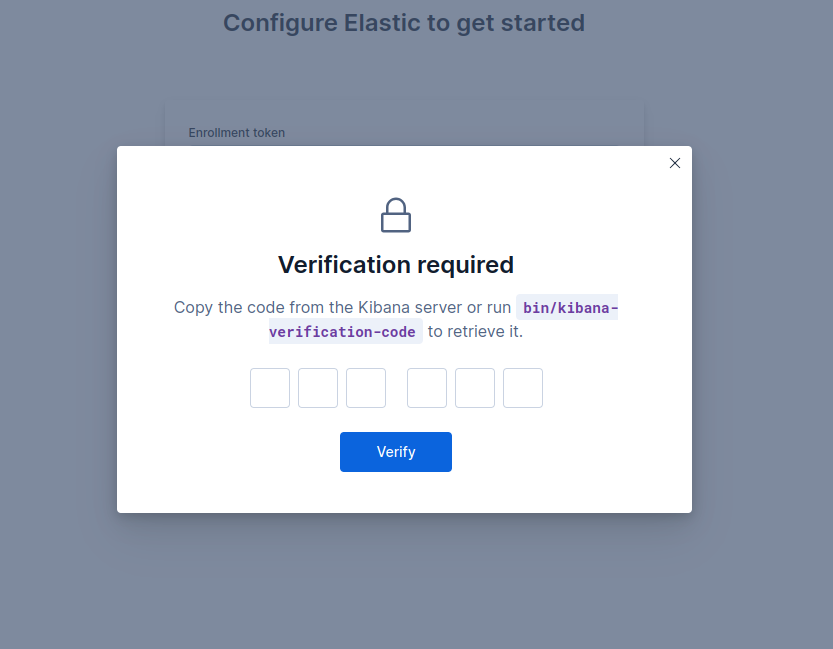
Now, you will get box to enter verification code. To get the verification code, execute following command:
/usr/share/kibana/bin/kibana-verification-code
You will get the 6 digit verification code. Fill that code in the browser. Once you do it will process the setup.
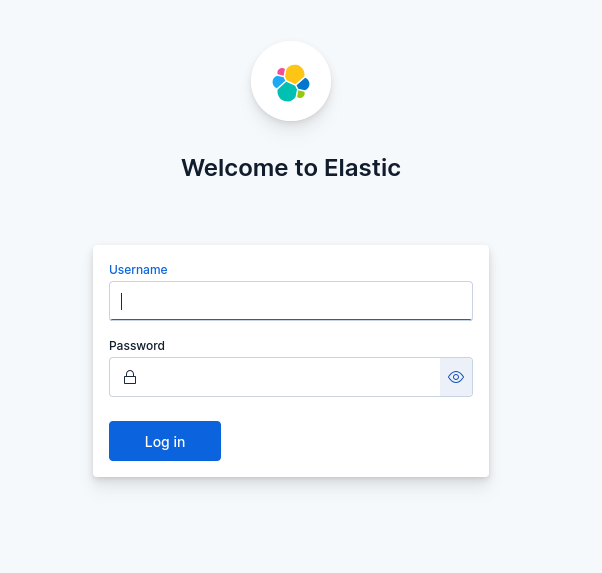
Once the process gets completed you will received a login form. Enter:
Username: elastic
password: <You have received it in step 3 after the Elasticsearch installation gets completed.>
6. Ship Logs with Filebeat
To collect logs from web servers, we deploy Filebeat on each node:
Install Filebeat via the same Elastic repo:
sudo dnf install -y --enablerepo=elasticsearch filebeat
Enable the Apache module (for example):
sudo filebeat modules enable apache
Configure Filebeat to point at Logstash in /etc/filebeat/filebeat.yml:
sudo vi /etc/filebeat/filebeat.yml
Add following content:
output.logstash:
  hosts: ["<elk_server_ip>:5044"]
  ssl.enabled: false
Start Filebeat:
sudo systemctl enable --now filebeat
7. Verify & Visualize in Kibana
Log into Kibana with the elastic user and password defined earlier.
Navigate to Stack Management > Index Patterns, and create a pattern matching logs-*.
Explore Discover to see ingested logs in real time.
Build visualizations and dashboards under Analytics, tailoring monitoring views to our hosting infrastructure metrics and application logs.
Conclusion
In this tutorial, we've learnt how to install and configure ELK stack on Rocky Linux 10. Deploying a centralized ELK Stack on Rocky Linux 10 offers our web hosting environment a powerful, scalable logging solution. By following these steps—installing prerequisites, configuring Elasticsearch, Logstash, and Kibana, securing the stack, and deploying Filebeat agents—we establish a comprehensive log-management platform.
With real-time insights and customizable dashboards, we can proactively monitor system health, troubleshoot issues, and optimize performance. Let’s harness ELK’s full potential to keep our infrastructure reliable, secure, and transparent for our team.
