
Learn step-by-step how to install and configure a centralized logging system using ELK Stack (Elasticsearch, Logstash, Kibana) on Ubuntu 24.04 server.
A centralized logging system simplifies monitoring, troubleshooting, and security analysis by aggregating logs from multiple sources into a single, searchable interface. The ELK Stack—comprising Elasticsearch, Logstash, and Kibana—is one of the most popular and powerful solutions available for this purpose. In this tutorial, we guide through the installation, configuration, and testing of the ELK Stack on an Ubuntu server, sharing best practices to ensure a robust and scalable logging system.
Why Centralized Logging Matters
When managing multiple servers and applications, logs get scattered across various machines and files. This fragmentation makes it difficult to spot patterns, diagnose issues quickly, or perform audits. By centralizing logs, all data is collected in one place, making search, visualization, and alerting much easier. ELK Stack enables this by combining:
- Elasticsearch: A distributed search and analytics engine that stores and indexes logs.
- Logstash: A data processing pipeline that collects, parses, and sends logs to Elasticsearch.
- Kibana: A visualization dashboard that helps explore and analyze the data stored in Elasticsearch.
Prerequisites
Before proceeding, make sure you have the following in place:
- A Fresh Ubuntu 24.04 dedicated server or KVM VPS.
- Root or Sudo Privileges
- Basic Linux commands knowledge.
Set Up a Centralized Logging System with ELK on Ubuntu 24.04 Server
Step 1: Preparing the Ubuntu Server
Before installation, update the Ubuntu server to ensure all packages are current.
sudo apt update && sudo apt upgrade -y
It’s best to run ELK on a dedicated server or virtual machine to allocate sufficient resources.
Step 2: Installing Java
Elasticsearch and Logstash require Java to run. Install OpenJDK 11, the recommended version for ELK components:
sudo apt install openjdk-21-jdk -y
java -version
Confirm the installation by checking the Java version.
Step 3: Installing Elasticsearch
Add the official Elasticsearch GPG key and repository to Ubuntu:
Download and install the public signing key:
wget -qO - https://artifacts.elastic.co/GPG-KEY-elasticsearch | sudo gpg --dearmor -o /usr/share/keyrings/elasticsearch-keyring.gpg
You may need to install the apt-transport-https package on Debian before proceeding:
sudo apt-get install apt-transport-https
Save the repository definition to /etc/apt/sources.list.d/elastic-9.x.list:
echo "deb [signed-by=/usr/share/keyrings/elasticsearch-keyring.gpg] https://artifacts.elastic.co/packages/9.x/apt stable main" | sudo tee /etc/apt/sources.list.d/elastic-9.x.list
Install the Elasticsearch Debian package:
sudo apt-get update && sudo apt-get install elasticsearch
Notice after the installation you will see "Security autoconfiguration information". In that information you will find something like:
The generated password for the elastic built-in superuser is : NN0rn_NHNd+kzrHtDIPQ
Copy that password. We need it to login at step 10.
Once installed, enable and start the Elasticsearch service:
sudo systemctl enable elasticsearch
sudo systemctl start elasticsearch
Step 4: Installing Logstash
Install Logstash from the same repository:
sudo apt install logstash -y
Enable Logstash to start on boot:
sudo systemctl enable logstash
sudo systemctl start logstash
Step 5: Installing Kibana
Kibana provides the web interface for visualizing logs.
sudo apt install kibana -y
sudo systemctl enable kibana
sudo systemctl start kibana
By default, Kibana listens on port 5601. To access Kibana remotely, update its configuration:
Edit /etc/kibana/kibana.yml:
nano /etc/kibana/kibana.yml
Find server.host and change its value to 0.0.0.0.
server.host: "0.0.0.0"
Restart Kibana:
sudo systemctl restart kibana
Step 6: Configuring Logstash Pipeline
Create a basic Logstash pipeline configuration file to ingest logs. For example, to receive syslog messages over UDP:
Create /etc/logstash/conf.d/syslog.conf:
nano /etc/logstash/conf.d/syslog.conf
Add following content:
input {
  udp {
    port => 514
    type => syslog
  }
}

filter {
  if [type] == "syslog" {
    grok {
      match => { "message" => "%{SYSLOGLINE}" }
    }
    date {
      match => [ "timestamp", "MMM  d HH:mm:ss", "MMM dd HH:mm:ss" ]
    }
  }
}

output {
  elasticsearch {
    hosts => ["localhost:9200"]
    index => "syslog-%{+YYYY.MM.dd}"
  }
  stdout { codec => rubydebug }
}
Restart Logstash to apply changes:
sudo systemctl restart logstash
Step 7: Sending Logs to Logstash
Configure your servers and applications to forward logs to the Logstash server's UDP port 514. For example, to forward syslog from a client server, modify /etc/rsyslog.conf or create a file in /etc/rsyslog.d/ with.
Run this command to create a new file:
sudo nano /etc/rsyslog.d/90-logstash.conf
Add the following line:
*.* @<logstash-server-ip>:514
Replace <logstash-server-ip> with the actual IP address or hostname where Logstash is running.
The single @ means UDP protocol is used for forwarding logs to Logstash. If you want to use TCP (more reliable), use double @@ instead.
Restart rsyslog:
sudo systemctl restart rsyslog
Step 8: Configure Firewall
We need to add 5601 tcp port in firewall.
ufw allow 5601/tcp
Step 9: Accessing Kibana Dashboard
Open a web browser and navigate to:
http://<elk-server-ip>:5601
The Kibana interface will allow creating index patterns (e.g., syslog-*) to start exploring logs.
Step 10: Testing the Setup
Navigate to browser and access http://<elk-server-ip>:5601.
You will get a box where you need to add Elasticsearch enrollment token. To generate the token execute following command:
/usr/share/elasticsearch/bin/elasticsearch-create-enrollment-token -s kibana
It will give you a token. Copy that token and paste it in the browser.
Now, you will get box to enter verification code. To get the verification code, execute following command:
/usr/share/kibana/bin/kibana-verification-code
You will get the 6 digit verification code. Fill that code in the browser. Once you do it will process the setup.
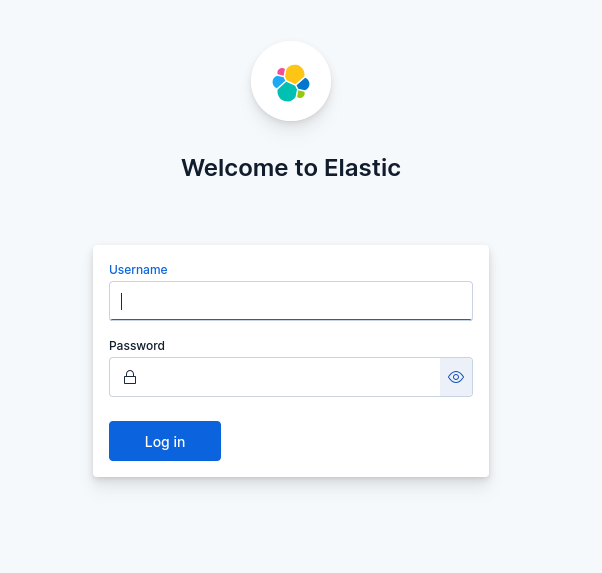
Once the process gets completed you will received a login form. Enter:
Username: elastic
password: <You have received it in step 3 after the Elasticsearch installation gets completed.>
Best Practices for a Centralized Logging System
- Secure the ELK stack: Use firewall rules to restrict access. Consider enabling TLS/SSL for communication between components.
- Monitor resource usage: ELK components can be resource-intensive. Allocate sufficient CPU, memory, and disk space.
- Implement log rotation: Manage Elasticsearch indices lifecycle to avoid disk space exhaustion.
- Use Beats for lightweight data shipping: For efficient log forwarding, Elastic’s Beats agents (Filebeat, Metricbeat) are ideal.
- Backup Elasticsearch data: Regular snapshots help recover in case of failure.
- Set up alerting: Use Elastic Stack alerting features or integrations to notify on critical events.
Final Thoughts
Setting up a centralized logging system using ELK Stack greatly enhances visibility into server and application behavior. It enables faster troubleshooting and proactive monitoring, which is vital for any web hosting environment. By following the steps above, our team can harness the full power of ELK on Ubuntu, delivering better service reliability and insight.
With proper setup and maintenance, this logging infrastructure will scale alongside growing server fleets, ensuring comprehensive log management for years to come.
